• I’ve been using SSMS 21 for the last fortnight and below are my first impressions, I’ve used SSMS in its many forms since around 2006 not long after it was first released.

    The new connection dialog

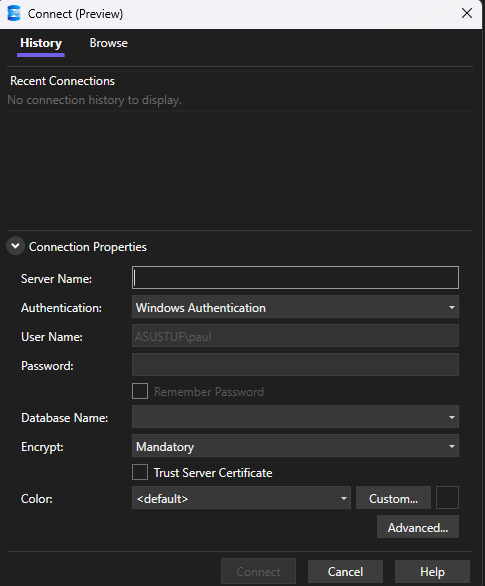
    The new connection dialog is very similar to the connection dialog box in Azure Data Studio (which has also been announced as being retired in February 2026), it makes switching between commonly used servers straight forward, allows you to set the default database to use when connecting and the service (SSAS, SSRS, database engine etc). This saves time and is a simple welcome change.
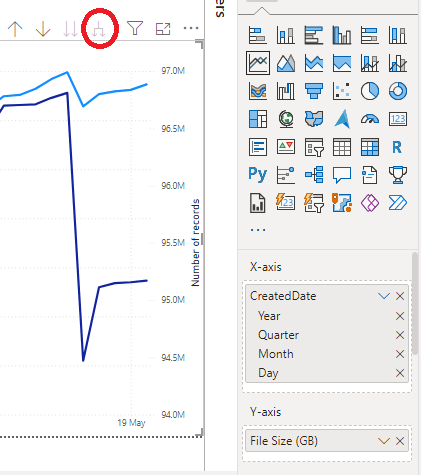
    Dark Mode

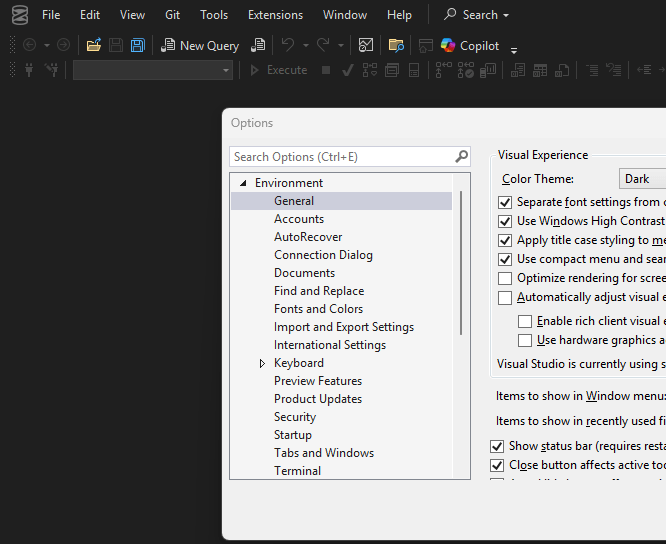
    Met with applause when it was announced at SQL Bits, dark mode is something that most data professionals have been keen on for SSMS. However not all dialogs/menus have been configured to operate in dark mode yet (see the example above), when I spoke to Erin from Microsoft she said that they were viewing the functionality of dark mode in each menu/screen as an ongoing task. As opposed to waiting for everything to be done prior to rolling it out to users.

    Whilst I use dark mode across Outlook, teams and Visual Studio, I am still a bit undecided on dark mode in SSMS. It is much easier on the eyes though, especially when you use a screen all day!

    Copilot

    I haven’t made use of the copilot features yet, so a big omission in my testing here. As it requires a licence and also I have some questions on what data it sends (query text or query results) before I can look at using it.

    Issues

    Existing SQL agent jobs that have steps that execute an SSIS package appear blank when opening them, I attempted to report this to Microsoft however they don’t consider this a bug due to SSIS not coming under the permit of SSMS 21 yet. This is really disappointing and users need to be careful they still have SSMS 20 to manage jobs of this type.

    I’ve had a few instances of it freezing, this has been difficult to repeat and have received updates to SSMS 21 since then, so might have already been addressed.

    The new icon for SSMS is perfectly fine, but muscle memory leaves me pausing, looking for the old trusty golden cylinder and crossed tools, however that is very much a me problem!

  • The guide below shows how to implement stored procedures that will monitor the disk space used by your databases and their tables.  Giving an understanding of areas utilising storage and the rate of storage consumption, allowing planning and monitoring, helping to limit the likelihood of that moment when the database grows and runs out of space.

    I also cover how the captured data can be analysed easily with a simple Power BI dashboard, to allow quick illustration of database storage utilisation.

    Step 1 – Create the database and its associated objects

    • Firstly create a database on your instance called “DatabaseMonitor”, you can use a different database name if your naming conventions dictate, however the scripts below will have to be modified accordingly.
    • Create the tables that will store the data using the two create scripts from my github below.

    https://github.com/mugleston/SqlDatabaseSizeTracking/blob/e4ed3545aacec6613c03bf79b3d57f4a8c19f54c/1.%20%20Create%20Tables

    • Create the stored procedures using the scripts below that will capture and write the disk consumption records to the newly created tables.

    Database Size Tracking Script

    https://github.com/mugleston/SqlDatabaseSizeTracking/blob/2540f19c9de1b0626d291825f79b635e95198cf6/2.%20%20Create%20Database%20Size%20tacking%20Stored%20Procedure

    Table Size Tracking Script

    https://github.com/mugleston/SqlDatabaseSizeTracking/blob/2540f19c9de1b0626d291825f79b635e95198cf6/3.%20%20Create%20Table%20Size%20tacking%20Stored%20Procedure

    Step 2 – Schedule the capture of database disk consumption

    Consider the frequency and timing of the stored procedures to run and as such take their file size snapshots, I run this every other day which gives plenty of data.

    • Open SQL Server agent on your server.
    • Create a new job with a name that matches your naming conventions (I simple use “Housekeeping – Database File Size capture”.
    • Create a step with a clear and brief name that executes the database table file size using the script “EXEC DatabaseMonitor.dbo.SpCaptureDatabaseTableSize”. This by default captures any table 150 MB or larger, this can be adjusted by running the stored procedure with the @SizeThreshold parameter set to the minimum level for the tables required.
    • Create a step with a clear and brief name that executes the database file size stored procedure using the script “EXEC DatabaseMonitor.dbo.SpCaptureDatabaseTableSize” This captures database sizes across all databases, including system databases, temp db and the DatabaseMonitor database itself.
    • Schedule the job, typically I would recommend every other day and at a quieter time such as evening prior to backups being performed.

    Step 3 – Allow the capture of data

    The job above will need to run for around 1-2 weeks to capture useful information to then be able to analyse disk consumption rates.  The code below creates views across the two tables, that can be plugged into a simple dashboard, with an over partition by in place to easily identify the latest size reading for that database/table.

    Database File Size View

    https://github.com/mugleston/SqlDatabaseSizeTracking/tree/6982deba3ce9ed0db4cef452c89d6283d2935d3f

    Table File Size View

    https://github.com/mugleston/SqlDatabaseSizeTracking/tree/79feb0b2f54afb955bf249ea92d14e2e4bb68d72

    Step 4 – Build Power BI Dashboard

    If you already have experience of building Power BI dashboards you can probably leap this step and simply make use of the new data you are capturing, however if that is not the case the following details the steps to do so.

    • Create a blank Power BI dashboard in Power BI Desktop.
    • Select data from your SQL server using the connection string and connecting to the views created earlier (VW_DbFileSize and VW_DbTableFileSize).
    • When summarising data in tree maps and other visualisations, its useful to be able to show the disk consumption expressed as the latest taken reading for that database.  Use the following DAX against VW_FbFileSize to create a measure that produces that result.
    Latest Database Reading (GB) = CALCULATE(sum(VW_DbFileSize[FileSizeGB]),VW_DbFileSize[IsLatestDatabaseReading]=1)

    In a similar theme to above, when summarising data in tree maps and other visualisations, its useful to be able to show the disk consumption expressed as the latest taken reading for that table.  Create the following DAX against VW_DbTableFileSize to create a measure that produces that result.

    Latest Table Reading (GB) = CALCULATE(sum(VW_DbTableFileSize[FileSizeGB]),VW_DbTableFileSize[IsLatestTableReading]=1)

    Create a simple line chart onto the visualisation canvas in Power BI, adding created date to the X axis and drill down the visualisation to its lowest granuality (see highlighted in red).

    • Add FileSizeGB to the Y axis, you now have a chart showing a clear breakdown of space consumption over time (the usefulness increases as more history is captured).
    • When creating the table version it is helpful to drag out the record count to the secondary Y axis, so both metrics can be viewed.
    • The tree map can also be used to display the database name/table name as the category and the values using the DAX measure we created. This shows clearly the last reading of the database/table and its context to other objects.

    The use of these stored procedures and Power BI allows you to create a simple dashboard, that allows you to clearly understand the trends in database disk consumption.

    Other ways to use system tables and these techniques, is utilising the data from the tables that underpin SQL Server Agent to understand job composition and easily compare day to day performance/degradation.

  • A common issue that I’ve encountered and certainly more than once, is where database inserts fail due to incorrectly sized identity fields. This is caused by the data type and its associated numerical limit being unable to store the next number in the identity sequence (known as the seed).

    This is easily resolved by changing the fields data type, however this often means that users are unable to insert errors when this is discovered. Sizing all of your datatypes to be larger than necessary on the off chance of this issue is ill advised, as there are storage and performance issues with using the wrong datatype.

    With this in mind I have created a simple script that identifies identity fields across a database, identifies the current seed and compares that against the associated limits based on the fields data type. This allows the monitoring of seed vs datatypes and more of a proactive approach taken to the problem.

    https://github.com/mugleston/SqlServerScripts/blob/master/IdentifyIdentityColumnsApproachingDataTypeMax

  • Many databases are designed in such a way that where a start/end time are stored there is no corresponding duration value, this is to avoid obvious data duplication and storage space as the duration can be calculated by comparing the start/end times. However some novice SQL coders struggle to calculate durations.

    In Microsoft SQL there is the datediff function however this is not present in Oracle so the most straight forward method is to subtract the start date from the end date, this produces the difference expressed fractions of a day (i.e. an hour is expressed as 0.41677777), multiplying the number by 24 then gives the figure in hours.

    (END_DATE – START_DATE) * 24

    An easy way check your logic is to use a value within a dual statement such as the one below, obviously including the dates you are anticipating so that you can be sure of what figure to expect. This saves considerable time than sticking a date comparison into your where clause and crossing your fingers!

    Select

    (TO_DATE(’01/08/2012 13:00′,’dd/mm/yyyy hh24:mi’) – TO_DATE(’01/08/2012 10:00′,’dd/mm/yyyy hh24:mi’)) * 24 Difference_hours,

    (TO_DATE(’31/07/2013′,’dd/mm/yyyy’) – TO_DATE(’01/08/2012′,’dd/mm/yyyy’)) Difference_Days

    From dual

  • Dates in oracle are stored in a format that doesn’t always make them friendly from a reporting point of view or dealing with data in Excel point of view, the TO_CHAR function can reformat your datetime fields so that they are more user friendly.

    Examples

    The statement is written with two parameters the exact name of the date field and the format (see second table).

    TO_CHAR(DATEFIELD,’FORMAT’)

    StatementResult
    TO_CHAR(DATEFIELD,’dd mm year’)23 05 twenty thirteen
    TO_CHAR(DATEFIELD,’dd/mm/yy’)23/05/2013
    TO_CHAR(DATEFIELD,’Day Month Year’)23 May Twenty Thirteen
    TO_CHAR(DATEFIELD,’dd/mm/yyyy hh24:mi’)23/05/2013 18:38

    Example formats

    Any combination of the following formats can be used, although obviously certain combinations may not make any sense to your end users.

    DescriptionExample
    Year/yearYear spelt out in text (with and without an upper case first digitTwenty Thirteen / twenty thirteen
    yyyyYear number in full2008
    yyLast two digits of year number08
    qQuarter of the year1 (February)
    mmMonth number within year**12 (December)
    Mon / monAbbreviated month name (with and without an uppercase first digit)Oct/oct
    Month / monthMonth name (with and without an upper case first digit)October / october
    wWeek number* (within month)1 (01/05/2013)
    wwWeek number* (within year) **18 (01/05/2013)
    dDay of the week1 (Monday)
    ddDay number within month**
    Dy/dyAbbreviated day name (with and without an uppercase first digit)Mon / mon
    Day / dayDay name (with and without an upper case first digit)Monday / Monday
    hh24Hour of the day in 24 hour format**16 (4pm)
    hhHour of the day in 12 hour format**04 (4pm)
    miMinute of the hour**52 (16:52)

    *Important note about week numbers

    Week numbers in oracle can be confusing as they start on the first day of the year and count seven days and then change, for example in 2013 the week number would increase each Wednesday.

    **Suppression of zeros

    This format can be prefixed with FM to suppress zeros, for example mm would display January as “01” where as if FMmm was used it would show “1”.

    How to test you date formatting

    The easiest method for testing the reformatting of your dates is to test them using the dual function, run the following SQL statement and substitute the area highlighted in yellow with the date format you are trying to use.

    select to_char(to_date(’01/05/2013 16:30′,’dd/mm/yyyy hh24:mi’),’Year’) from dua

  • Hopefully this can help someone else out that has this issue, I had the error “Error 1 There was an exception running the extensions specified in the config file. —> Maximum request length exceeded” displayed when publishing what I believed was a relatively straight forward SSRS report.

    Upon googling most of the solutions tended to hint at it being related to a large mapping component being present, however this wasn’t present in my report.

    I then realised that the report I had written was done by copying an existing report as a starting point, that report had a few very large (file size wise) images, although I had deleted them from the report. Looking in the Report Data > Images location I can still see them referenced in there, deleting them from there resolved the issue.

    • How to format an address block in SSRS, ideal for SSRS generated letters, invoices, bills and orders.
    • Removes any blank address lines that the record has in your database.
    • Adds carriage returns after each populated line to give the distinctive address block appearance

    There are two ways to approach msaaging/formatting fields into an address block in SSRS, you can either carry out your formatting in the SQL that populates the dataset or you can format the fields from the dataset in an SSRS expression.

    I’ve found that the easiest method is to format the address through an SSRS expression contained in the report, this keeps the SQL that populates the dataset as clear as possible and any issues associated with the expression are easily identifiable.

    Example Data

    · Stored in dataset titled “DATASET”

    · The exact number/naming of fields will differ depending on your database.

    MAILING_NAMEMr J Davies
    ADD1The Whitehouse
    ADD2
    ADD3Reindeer Road
    ADD4
    ADD5
    TOWNReading
    PCODENA13 6DF
    COUNTRYUnited Kingdom

    Example expression

    Create a new text box and add the following expression (change the name of the dataset/fields to reflect your data).

    =First(Fields!MAILING_NAME.Value,”DATASET”)+IIF(First(Fields!MAILING_NAME.Value,”DATASET”) =””,””,”, “+VbCrLf)

    +First(Fields!ADD1.Value,”DATASET”)+IIF(First(Fields!ADD1.Value,”DATASET”) =””,””,”, “+VbCrLf)

    +First(Fields!ADD2.Value,”DATASET”)+IIF(First(Fields!ADD2.Value,”DATASET”) =””,””,”, “+VbCrLf)

    +First(Fields!ADD3.Value,”DATASET”)+IIF(First(Fields!ADD3.Value,”DATASET”) =””,””,”, “+VbCrLf)

    +First(Fields!ADD4.Value,”DATASET”)+IIF(First(Fields!ADD4.Value,”DATASET”) =””,””,”, “+VbCrLf)

    +First(Fields!ADD5.Value,”DATASET”)+IIF(First(Fields!ADD5.Value,”DATASET”) =””,””,”, “+VbCrLf)

    +First(Fields!TOWN.Value,”DATASET”)+IIF(First(Fields!TOWN.Value,”DATASET”) =””,””,”, “+VbCrLf)

    +First(Fields!PCODE.Value,”DATASET”)+IIF(First(Fields!PCODE.Value,”DATASET”) =””,””,””+VbCrLf)

    +First(Fields!COUNTRY.Value,”DATASET”)

    Example report view

    Mr J Davies,

    The Whitehouse,

    Reindeer Road,

    Reading,

    NA13 6DF,

    United Kingdom

  • I wrote this guide around 14 years ago after having nothing but problems with Microsoft Business Intelligence Development Studio for around 7 hours, so thought I’d post the solution to save someone else the hassle!

    Problem

    When using groupings in a table, an expression consisting of a SUM and an immediate if (IIF) can be used to sum/count/aggregate values where another value in the dataset meets a certain condition. In my example below where the academic year is = “2010/2011” I want to include the grade value (a numeric).

    =SUM(IIF(fields!Academic_year.value = “2010/2011”,Fields!Grade.value,0))

    However despite the report working in in BIDS, after deploying the report and viewing it on the SSRS server I get #error on some/all of the groups.

    Solution

    For some reason the SSRS server when rendering the report is struggling to interpret the grade field as a numeric and also the 0. The use of the VAL conversion function removes this problem.

    =SUM(VAL(IIF(fields!Academic_year.value = “2010/2011”,Fields!Grade.value,0)))