
The guide below shows how to implement stored procedures that will monitor the disk space used by your databases and their tables. Giving an understanding of areas utilising storage and the rate of storage consumption, allowing planning and monitoring, helping to limit the likelihood of that moment when the database grows and runs out of space.
I also cover how the captured data can be analysed easily with a simple Power BI dashboard, to allow quick illustration of database storage utilisation.
Step 1 – Create the database and its associated objects
- Firstly create a database on your instance called “DatabaseMonitor”, you can use a different database name if your naming conventions dictate, however the scripts below will have to be modified accordingly.
- Create the tables that will store the data using the two create scripts from my github below.
- Create the stored procedures using the scripts below that will capture and write the disk consumption records to the newly created tables.
Database Size Tracking Script
Table Size Tracking Script
Step 2 – Schedule the capture of database disk consumption
Consider the frequency and timing of the stored procedures to run and as such take their file size snapshots, I run this every other day which gives plenty of data.
- Open SQL Server agent on your server.
- Create a new job with a name that matches your naming conventions (I simple use “Housekeeping – Database File Size capture”.
- Create a step with a clear and brief name that executes the database table file size using the script “EXEC DatabaseMonitor.dbo.SpCaptureDatabaseTableSize”. This by default captures any table 150 MB or larger, this can be adjusted by running the stored procedure with the @SizeThreshold parameter set to the minimum level for the tables required.
- Create a step with a clear and brief name that executes the database file size stored procedure using the script “EXEC DatabaseMonitor.dbo.SpCaptureDatabaseTableSize” This captures database sizes across all databases, including system databases, temp db and the DatabaseMonitor database itself.
- Schedule the job, typically I would recommend every other day and at a quieter time such as evening prior to backups being performed.
Step 3 – Allow the capture of data
The job above will need to run for around 1-2 weeks to capture useful information to then be able to analyse disk consumption rates. The code below creates views across the two tables, that can be plugged into a simple dashboard, with an over partition by in place to easily identify the latest size reading for that database/table.
Database File Size View
https://github.com/mugleston/SqlDatabaseSizeTracking/tree/6982deba3ce9ed0db4cef452c89d6283d2935d3f
Table File Size View
https://github.com/mugleston/SqlDatabaseSizeTracking/tree/79feb0b2f54afb955bf249ea92d14e2e4bb68d72
Step 4 – Build Power BI Dashboard
If you already have experience of building Power BI dashboards you can probably leap this step and simply make use of the new data you are capturing, however if that is not the case the following details the steps to do so.
- Create a blank Power BI dashboard in Power BI Desktop.
- Select data from your SQL server using the connection string and connecting to the views created earlier (VW_DbFileSize and VW_DbTableFileSize).
- When summarising data in tree maps and other visualisations, its useful to be able to show the disk consumption expressed as the latest taken reading for that database. Use the following DAX against VW_FbFileSize to create a measure that produces that result.
Latest Database Reading (GB) = CALCULATE(sum(VW_DbFileSize[FileSizeGB]),VW_DbFileSize[IsLatestDatabaseReading]=1)In a similar theme to above, when summarising data in tree maps and other visualisations, its useful to be able to show the disk consumption expressed as the latest taken reading for that table. Create the following DAX against VW_DbTableFileSize to create a measure that produces that result.
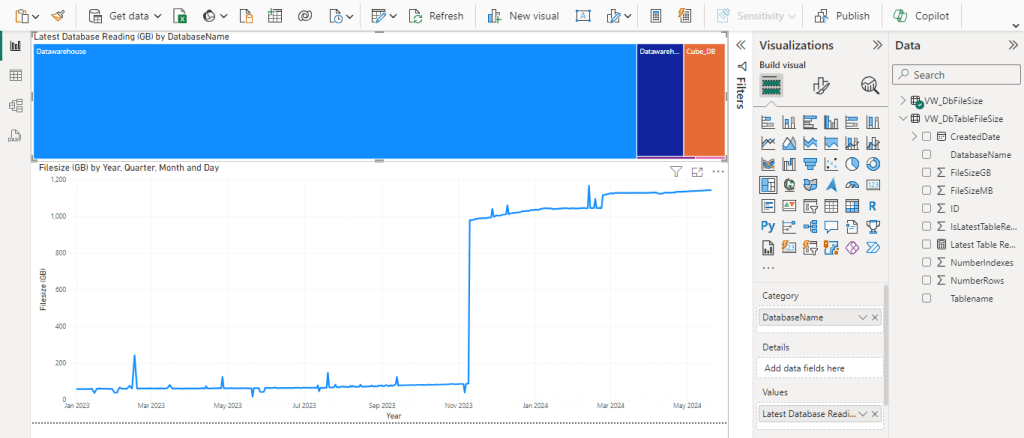
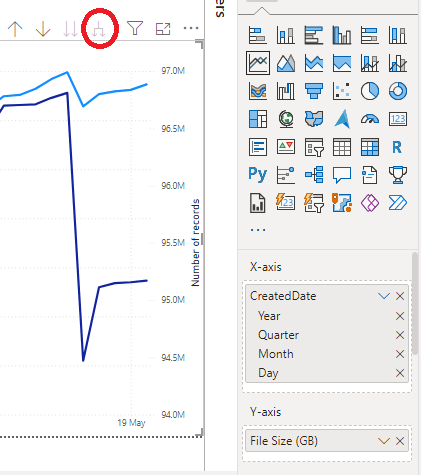
Latest Table Reading (GB) = CALCULATE(sum(VW_DbTableFileSize[FileSizeGB]),VW_DbTableFileSize[IsLatestTableReading]=1)Create a simple line chart onto the visualisation canvas in Power BI, adding created date to the X axis and drill down the visualisation to its lowest granuality (see highlighted in red).
- Add FileSizeGB to the Y axis, you now have a chart showing a clear breakdown of space consumption over time (the usefulness increases as more history is captured).
- When creating the table version it is helpful to drag out the record count to the secondary Y axis, so both metrics can be viewed.
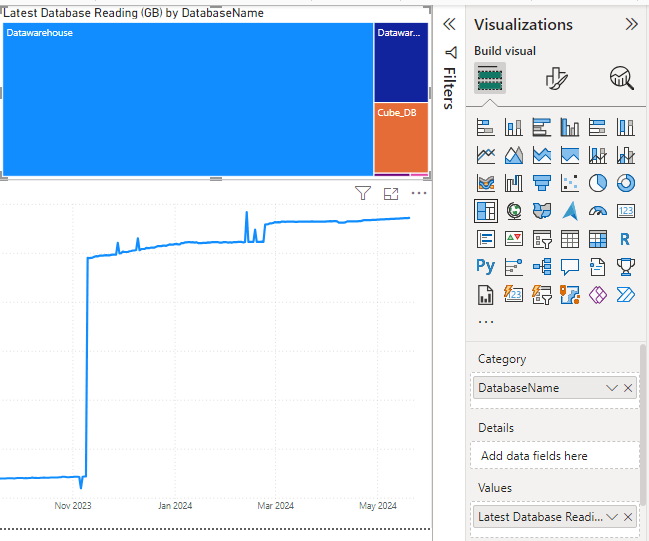
- The tree map can also be used to display the database name/table name as the category and the values using the DAX measure we created. This shows clearly the last reading of the database/table and its context to other objects.
The use of these stored procedures and Power BI allows you to create a simple dashboard, that allows you to clearly understand the trends in database disk consumption.
Other ways to use system tables and these techniques, is utilising the data from the tables that underpin SQL Server Agent to understand job composition and easily compare day to day performance/degradation.

Leave a comment